In the last decade, with the increase of components inside Ops infrastructures, monitoring has started to be more than ever a central component. Having a monitored infrastructure helps to not navigate blindly inside a constellation of services and to be pro-active on issues. Monitoring can be defined as a shaped form of metrics and these metrics are often divided into two categories: applicative and system. In this blogpost, let’s put on our Scaphandre to dive into an unusual system metric: the energy.
Energy is a concept widely spread across science – in that case, we will focus on electrical energy. This one can be defined with Joules (J) or Watt (W) units. With a simple relation we can pass from one to the other:
$$ 1 W = 1 J / s $$
In 2011, a patch landed on the Linux kernel to introduce “intel_rapl” driver. It provides a unified interface to read the energy consumed by different power zones of the CPU using powercap framework:
cat /sys/class/powercap/intel-rapl:0*/name
core # CPU cores
uncore # integrated graphics, ...
dram # RAM attached to the integrated memory controller
package-0 # CPU entire socket
Leaving the kernel to the user space, it’s now possible to use high-level software like Scaphandre to fetch and serve these metrics through various exporters (JSON, stdout, Prometheus, etc.). As seen previously, it’s first required to configure the kernel to build “intel_rapl” driver and “powercap” framework – it has been done for Flatcar in this PR: flatcar/coreos-overlay#1801 and it’s available since the release 3227.0.0.
Let’s see how to deploy and provision Scaphandre on a Flatcar instance with QEMU/KVM. We first need to generate an Ignition configuration – It’s possible to run Scaphandre directly from a Docker image. Here’s a Butane configuration:
---
variant: flatcar
version: 1.0.0
passwd:
  users:
    - name: core
      ssh_authorized_keys:
        - ssh-rsa ...
systemd:
  units:
    - name: scaphandre-prometheus.service
      enabled: true
      contents: |
        [Unit]
        Description=Scaphandre Prometheus exporter
        [Service]
        Type=fork
        ExecStartPre=-/usr/bin/mkdir --parents /var/scaphandre
        ExecStartPre=-/usr/bin/docker stop scaphandre
        ExecStartPre=-/usr/bin/docker rm scaphandre
        ExecStartPre=/usr/bin/docker pull hubblo/scaphandre:latest
        ExecStart=/usr/bin/docker run \
          --name scaphandre \
          --network=host \
          --volume="/proc:/proc" \
          --volume="/var/scaphandre:/var/scaphandre" \
          --volume="/sys/class/powercap:/sys/class/powercap" \
          hubblo/scaphandre:latest \
          --vm prometheus
        [Install]
        WantedBy=multi-user.target
    - name: var-scaphandre.mount
      enabled: true
      contents: |
        [Unit]
        Description=Mount scaphandre filesystem
        Conflicts=umount.target
        Before=umount.target

        [Mount]
        What=scaphandre
        Where=/var/scaphandre
        Type=9p
        Options=trans=virtio

        [Install]
        WantedBy=multi-user.target
Ignition configuration can be generated with the following command:
butane ./config.yml -o ./ignition.json
Now we have an Ignition configuration, we can follow the official documentation: https://www.flatcar.org/docs/latest/installing/vms/libvirt/
It’s required to drift a bit from the documentation to generate the XML
before defining the domain (--print-xml > flatcar-linux1.xml) to
add the following filesystem config to the <devices> block:
<devices>
    <filesystem type='mount' accessmode='passthrough'>
     <source dir='/var/lib/libvirt/scaphandre/flatcar-linux1'/>
     <target dir='scaphandre'/>
     <readonly/>
     <address type='pci' domain='0x0000' bus='0x00' slot='0x07' function='0x0'/>
   </filesystem>
   ...
This is mandatory to bridge the guest with the host: the host will compute the energy consumption metrics for each running VM.
On the host, the following command needs to be run. It will create a filetree compatible with powercap for each VM found:
$ sudo scaphandre qemu
(For Gentoo users, an app-metrics/scaphandre package is available on
::guru overlay)
Default filetree is created in the following location:
/var/lib/libvirt/scaphandre/${DOMAIN_NAME} - and with the current
example, we have the following:
$ tree /var/lib/libvirt/scaphandre/flatcar-linux1
/var/lib/libvirt/scaphandre/flatcar-linux1
├── intel-rapl:0
│   └── energy_uj
└── intel-rapl:0:0
2 directories, 1 file
All components are now in place, we can define and start the domain:
$ virsh define --file flatcar-linux1.xml
$ virsh start flatcar-linux1
Once the instance up, Prometheus metrics should be available at http://DOMAIN_IP:8080/metrics and they can be interfaced with usual tools like Grafana. Voilà !
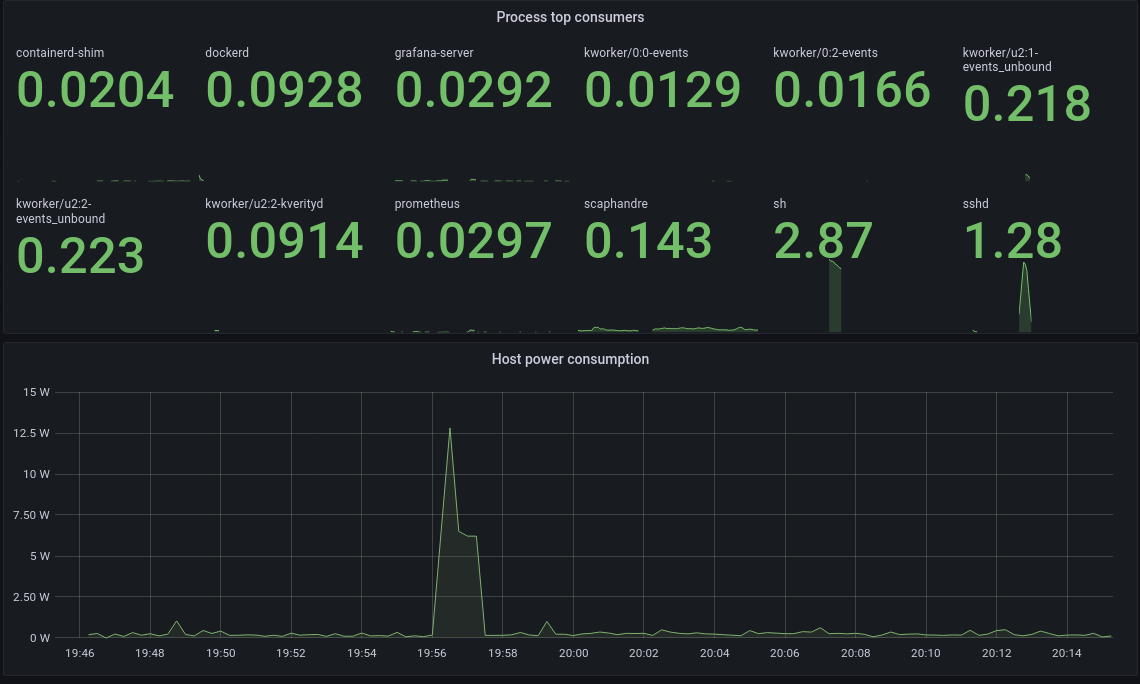
Displaying metrics and graphs is “easy”: give time, datasources and dashboards to someone creative, you’ll get beautiful graphs, histograms, and table by the end of the day but certainly without any sense. Complexity resides in the understanding of this data and actions you can take based on it: infrastructure energy consumption is one of these metrics that reveal the thin border between digital and real worlds and how it’s possible to impact one from the other by taking the right actions.